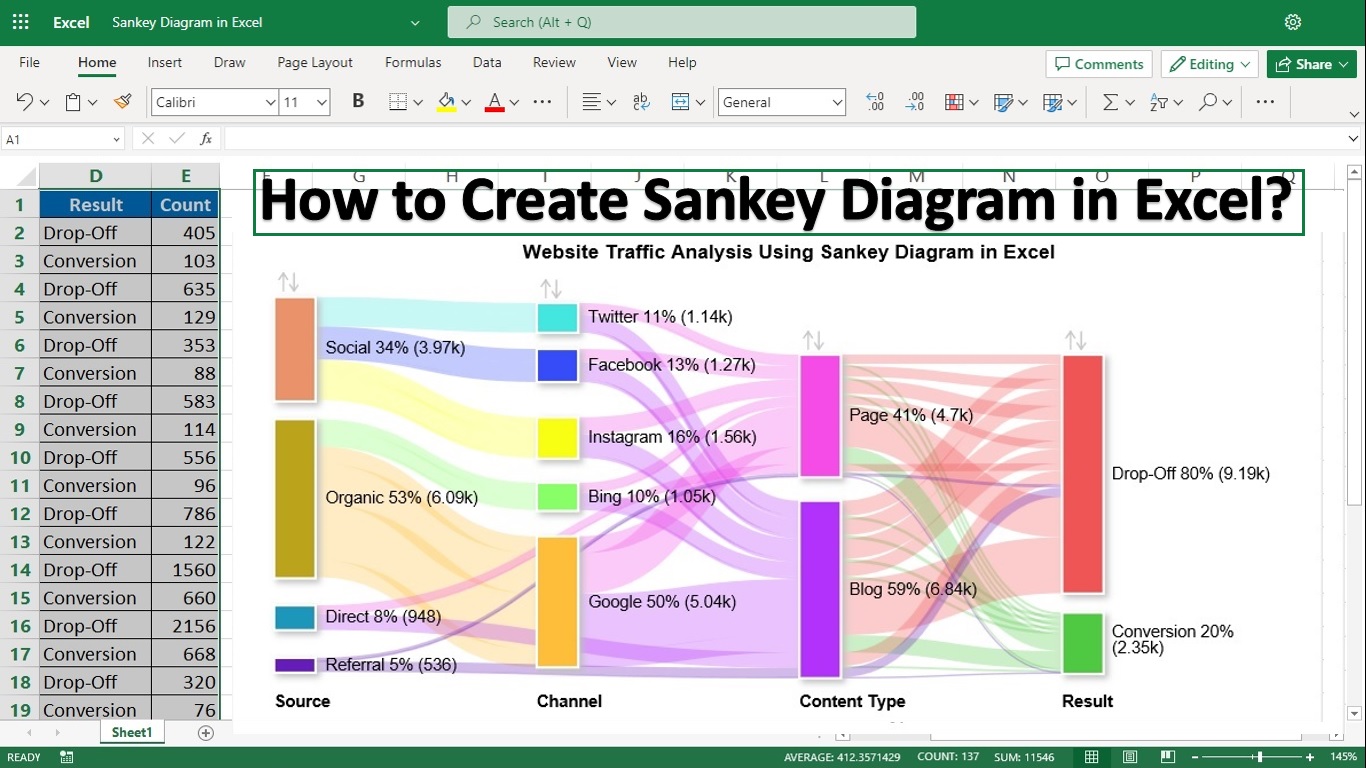
Click to learn what is a Sankey Chart, its components, and how to create a Sankey Diagram in Excel Using the Best Sankey Diagram Generators.

Best Types of Charts and Graphs in Excel and Their Uses
Unlock the secrets of data visualization with our comprehensive guide to Types of Charts and Graphs in Excel. Over 750M users can’t be wrong!
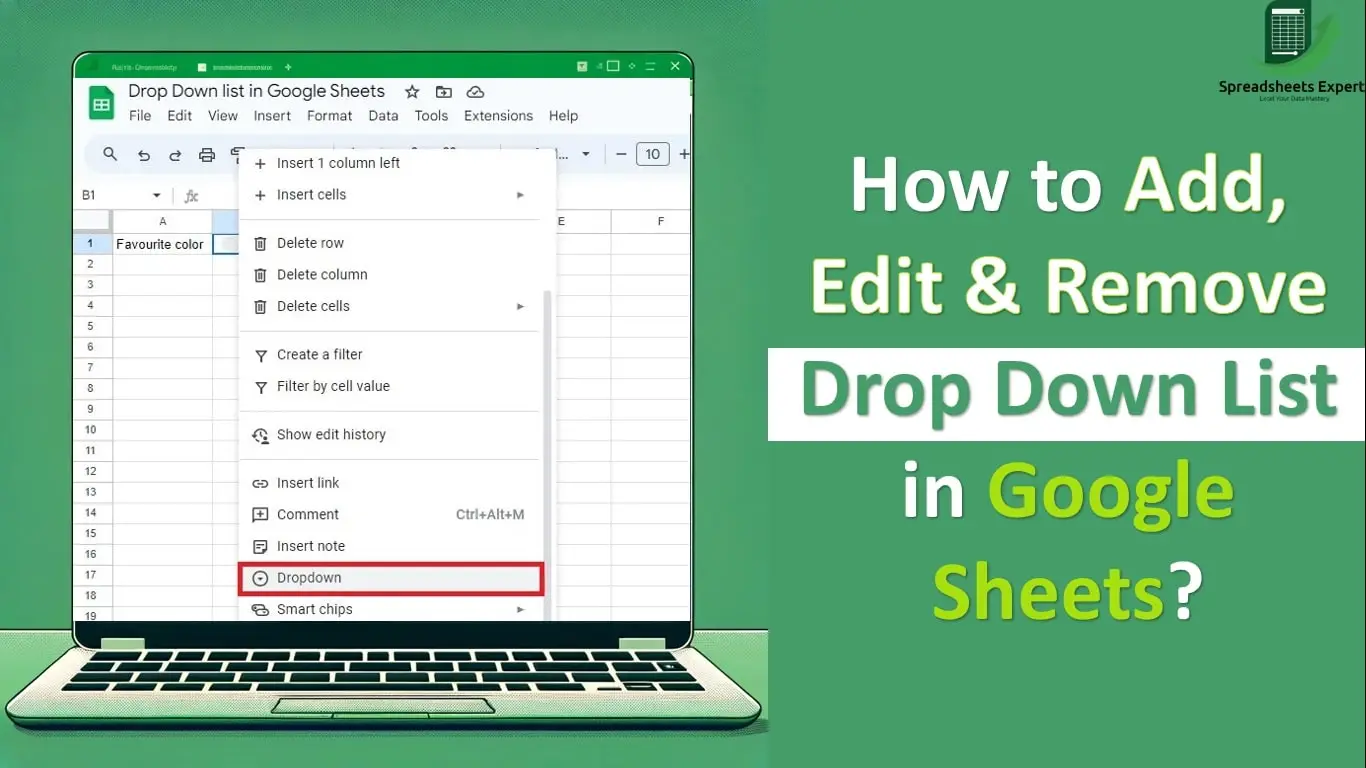
How to Add, Edit & Remove Drop Down List in Google Sheets?
Master Google Sheets Drop Down List! Learn to create, add, edit, and remove drop-down lists in Google Sheets effortlessly for streamlined data management.
How To Create Data Visualizations in Excel? A Complete Guide
Elevate insights with data visualizations in Excel! Learn techniques to present data effectively for informed decision-making using the Excel Visualization Tool.
Excel Filter Not Working – Issues & How to Resolve/Fix
Find out why your Excel filter isn’t working, along with helpful tips on diagnosing and resolving typical problems
How to Insert Check Mark (Tick ✓) Symbol in Excel?
Learn How to Insert a Check Mark (Tick ✓) Symbol in Excel
to streamline task management, enhance your sheets’ clarity & visual tracking of accomplishments.

How to Wrap Text in Google Sheets?
Master How to Wrap Text in Google Sheets. Wrapping text in Google Sheets maintains cell visibility, prevents data overlap, & enhances spreadsheet readability.
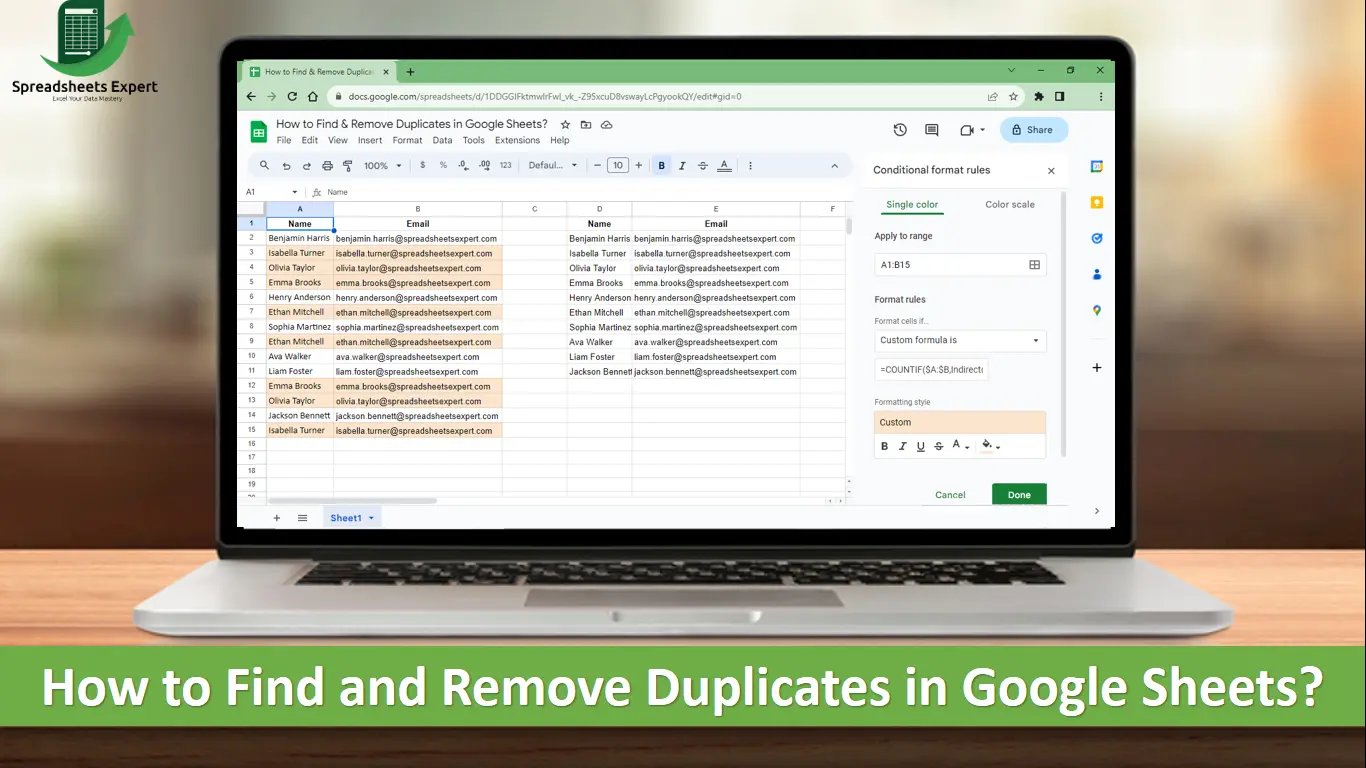
How to Find and Remove Duplicates in Google Sheets?
Google Sheets does not have a function to highlight duplicates so learn in this guide How to Find and Remove Duplicates in Google Sheets with formula.

How to Sort in Google Sheets? Step-by-Step Guide
Master How to Sort in Google Sheets with our step-by-step guide, enhance data analysis, simplify finding patterns, and improve overall data readability.

15+ Best Data Visualization Tools for 2024
Discover the best Data Visualization Tools. Elevate your insights with our guide, empowering you to choose the best tools for impactful data representation.