Tracking the progress of your projects is a very critical task that you might have to do in your daily routine. Many managers use paid tools to monitor the progress of their projects. But do you know that you can also monitor the progress in Excel just by using the progress bar feature in conditional formatting?
You can also use a progress bar chart in excel to track the progress of your tasks and projects.
Excel is used by almost every type of professional, particularly project managers. Microsoft has worked hard in developing and improving its features. One of the very attractive, effective, and useful features is conditional formatting.
You can use conditional formatting to format data, highlight duplicates, apply rules to your data, and add data bars (progress bar). Yes, you can add a progress bar in excel with 1 click using this conditional formatting feature.
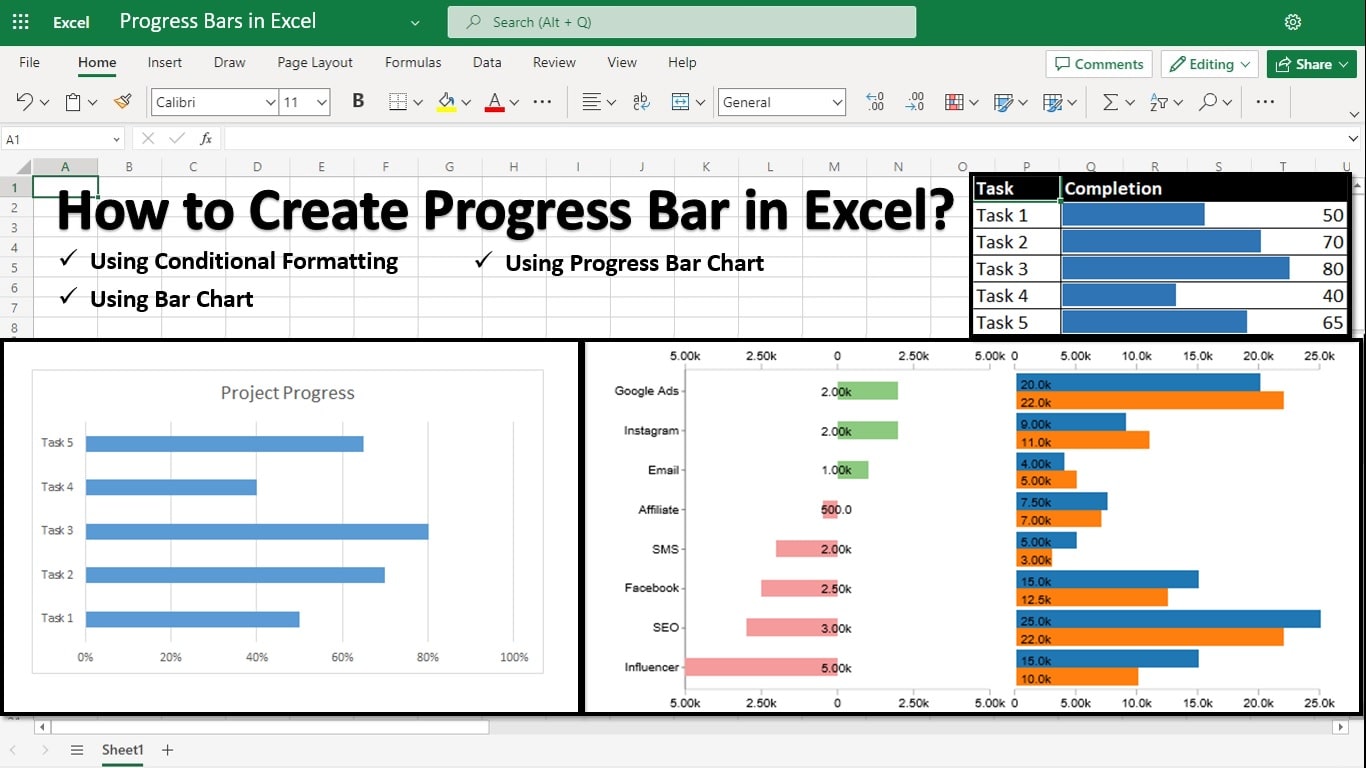
How to Create Progress Bar in Excel?
There are many ways to create a progress bar in excel. You can use conditional formatting to create a progress bar. You can also create a progress bar chart to show the progress of different projects in one chart.
Let’s discuss them one by one.
-
Create Progress Bar Using Conditional Formatting:
Follow the steps below to create a progress bar in your Excel application using conditional formatting.
- Open your Excel application.
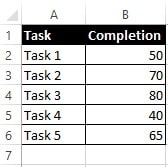
- Enter the data on which you want to draw the progress bar as shown below.
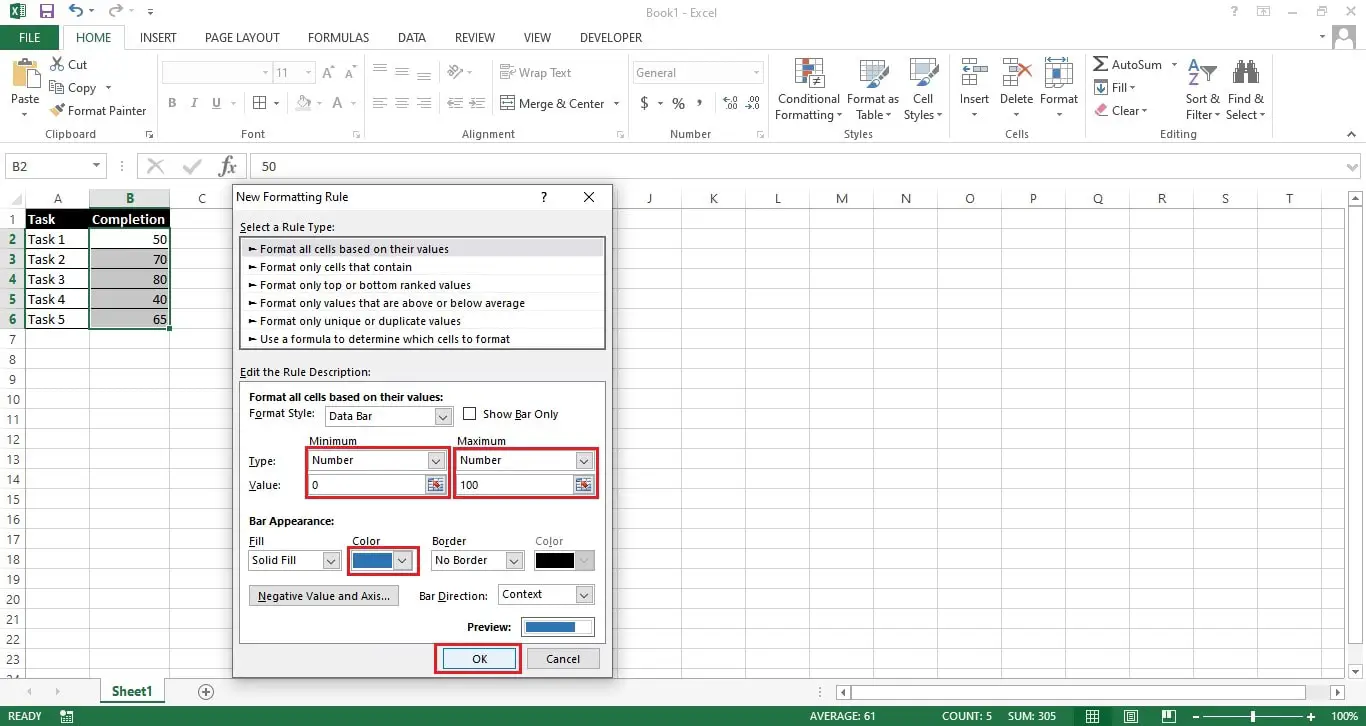
- Select the Values in Column B: “Completion”. Then go to Home -> Conditional Formatting -> Data Bars -> More Rules as shown below.
- Enter the Minimum and Maximum values, then select the color you want to show in the bars. Then press ok to complete the process.
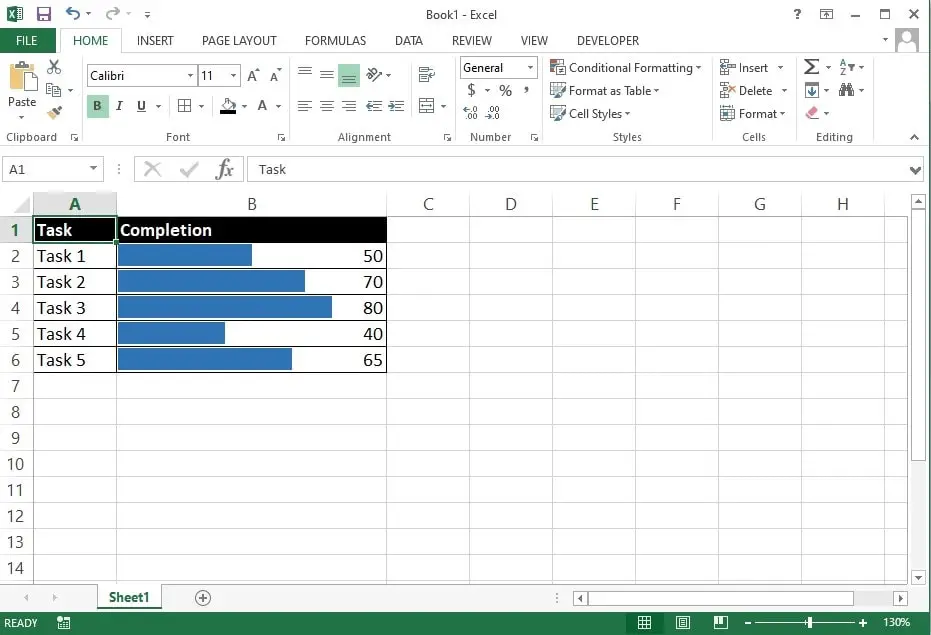
- You can see the progress bar against each task as shown below:
-
Create Progress Bar Chart in Excel Using Bar Chart:
To create a progress bar chart in excel to show the progress of different tasks in a project in one chart or to show the progress of different projects in one chart, follow the steps below:
- Open your Excel application.
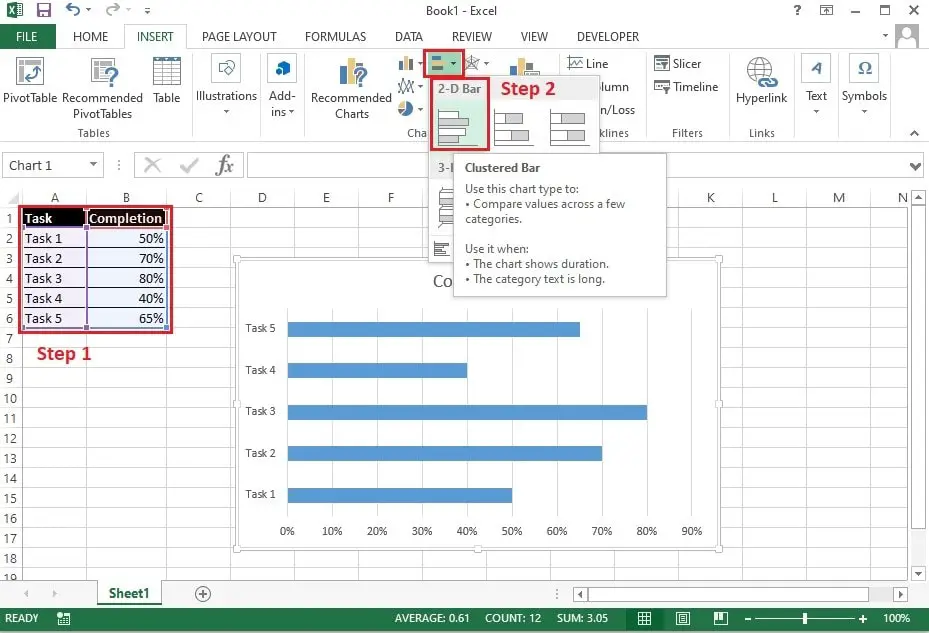
- Enter the data on which you want to create a progress bar chart.
- Now click on Insert and then click on the “Insert Bar Chart” icon in the Charts section. From there you can select “Clustered Bar Chart” as shown below.
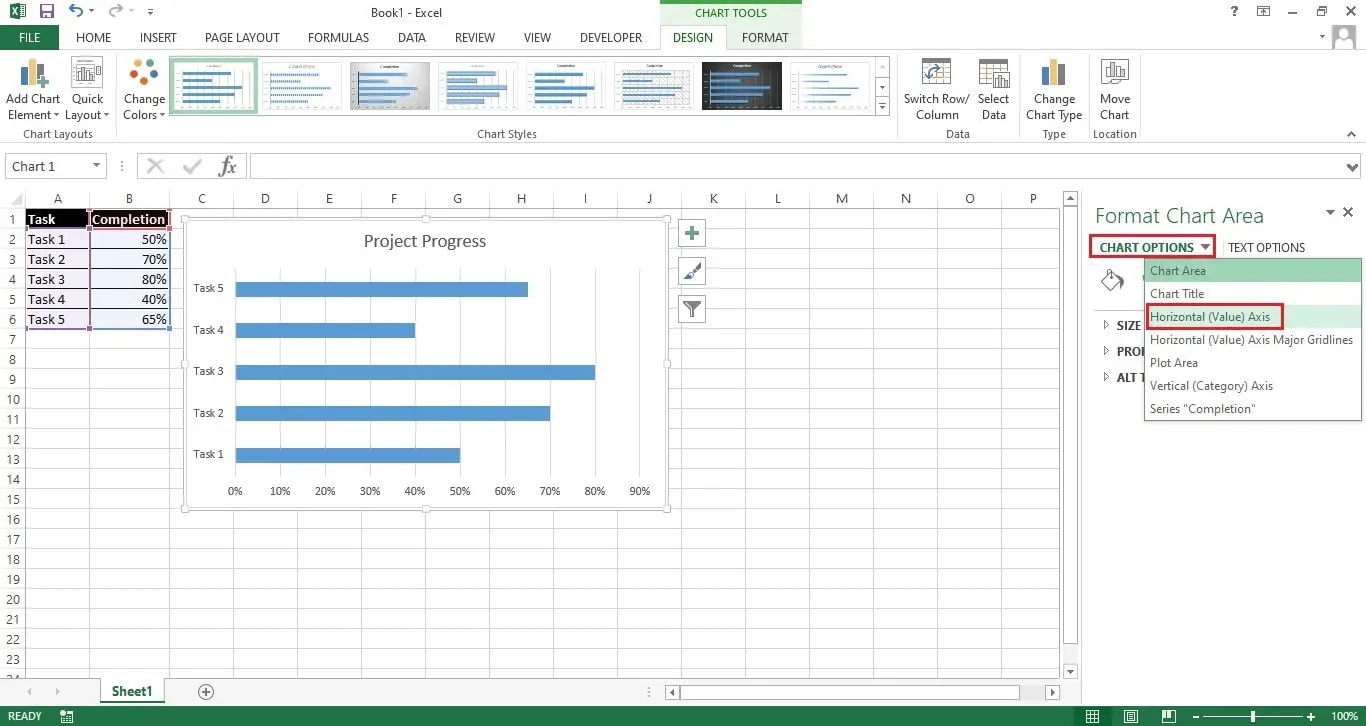
- Now right-click on the chart and then click on “Format Chart Area”.
- After this click on Chart Options then select “Horizontal (axis) Value”, as shown below.
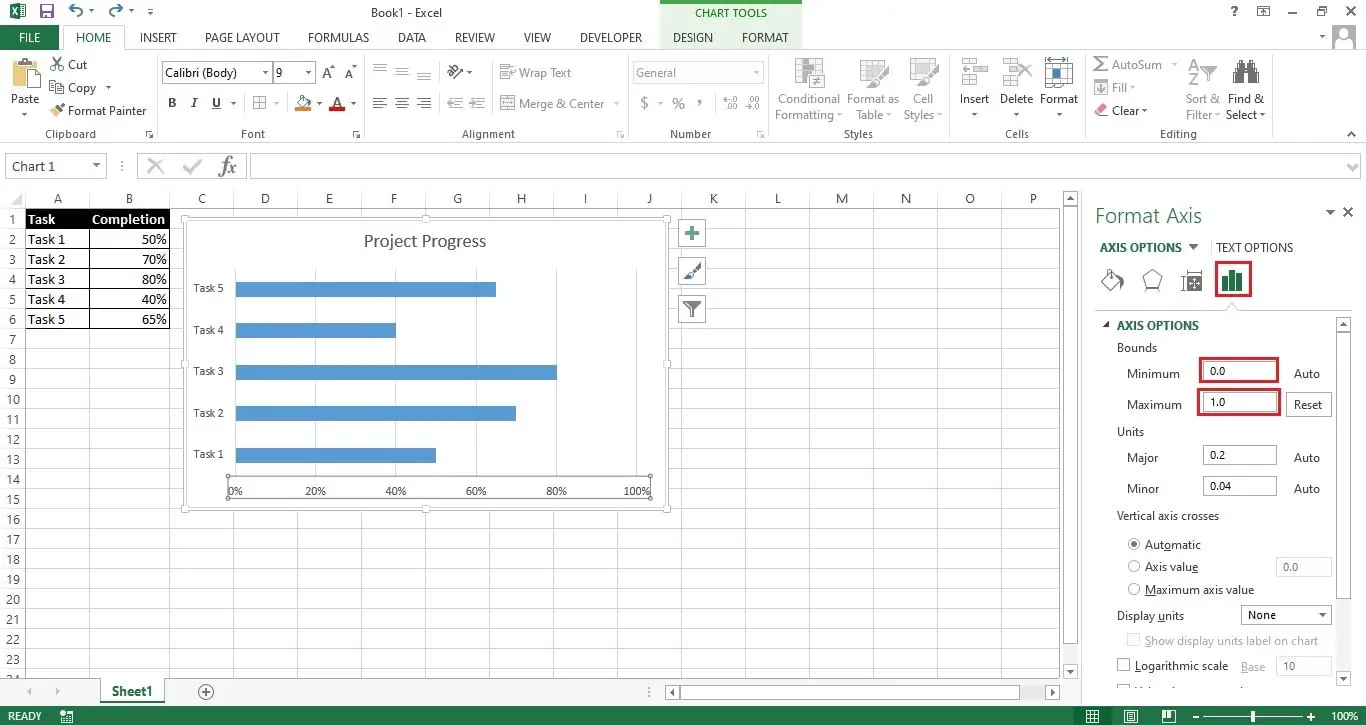
- Now click on the Bar Chart icon on the right and then enter the minimum and maximum values based on your data. In our example, the minimum value possible is 0 and the maximum is 1 which shows 100%. After entering the values in highlighted cells press enter to make changes in the chart.
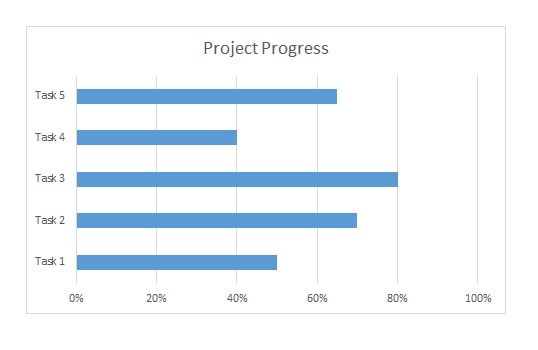
- You will get the final Progress Bar Chart as shown below:
-
Create Progress Bar Chart in Excel Using ChartExpo:
- Open your Excel application.
- Enter the data on which you want to create a progress bar chart in excel.
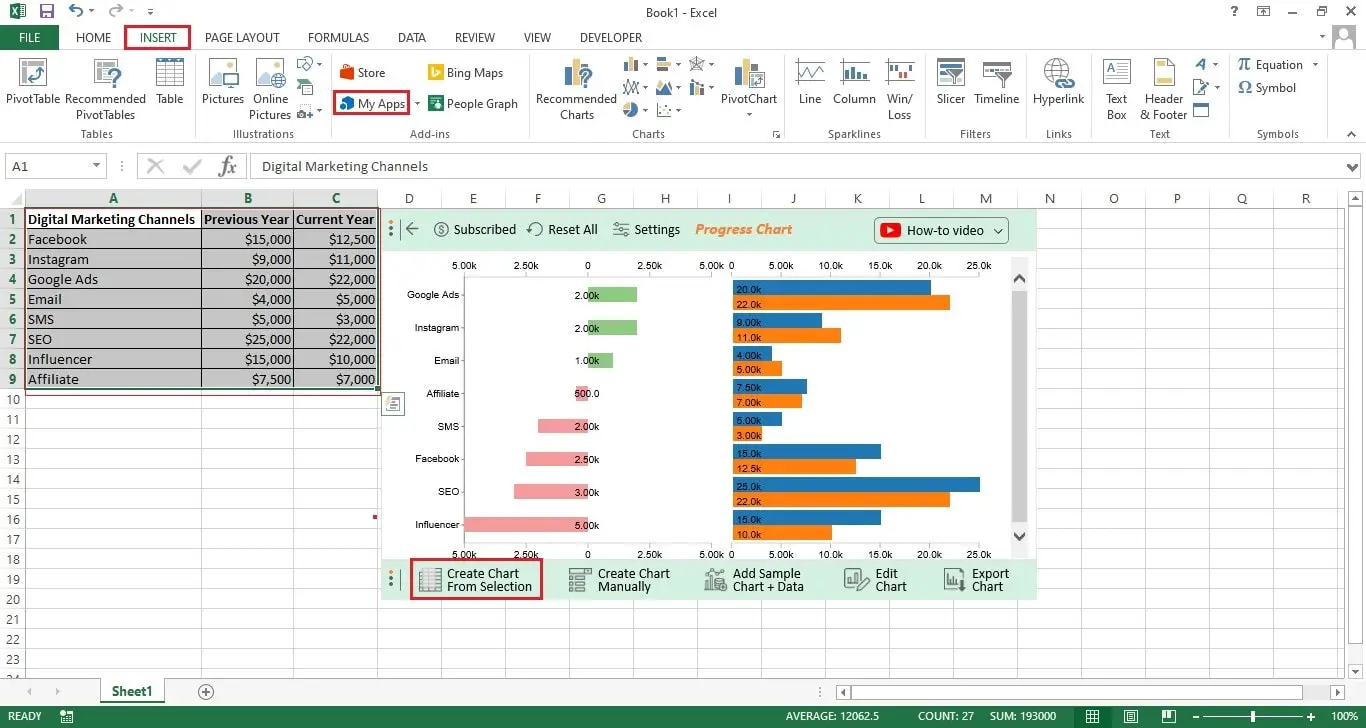
- Now go to Insert and click on My Apps.
- Select ChartExpo for Excel from the list.
- Once ChartExpo add-in loads, you will see a list of charts in it.
- Either scroll or type “Progress Chart” in the search bar. Once the Progress Chart icon shows, click on it to load the chart.
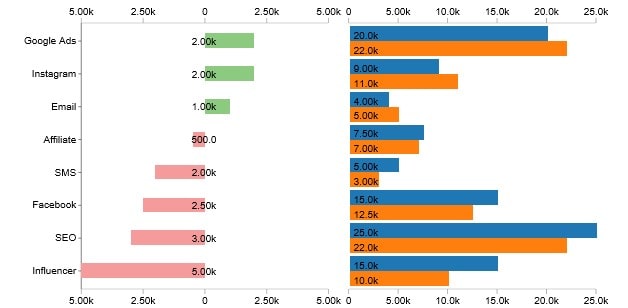
- Now select the data in the excel sheet on which you want to create this chart and click on “Create Chart From Selection”. You will get the following chart:
- Your final Progress Chart will look as follows.
With over two decades of experience in writing about Microsoft Excel, Google Sheets, and various other spreadsheet tools, Muhammad Nadeem Salam is your go-to expert for all things data. Since 2004, he has been passionately sharing his knowledge and insights through engaging and informative blog posts, helping countless readers unlock the full potential of their spreadsheet tools.

One thought on “How to Create a Progress Bar in Excel?”