It is very important for a manager to keep track of the progress of tasks assigned to your team. Without tracking the progress you won’t be able to meet the deadlines of your projects.
But as a manager, you don’t want to spend a lot of time tracking progress. The solution is simple. Use the progress bar in Google Sheets to track project completion. The second thing you can do is use Progress Bar Chart to track the project’s progress.
Do not worry, as we will explain both ways in detail so you can use whichever method suits you best.
Google Sheets is a very helpful tool for data management. It’s also helpful due to its best features like sharing, editing online, team management, etc. That’s why managers and teams use it for data analysis and team coordination.
How to Create Progress Bars in Google Sheets?
You can create progress bars in Google Sheets using 2 strategies. The first is to use the sparkline formula. The second is to use Progress Bar Chart in Google Sheets.
Let’s explain both ways in detail.
-
Creating Progress Bar in Google Sheets using Sparkline:
In Google Sheets, you can very easily create a Progress bar using the function of “Sparkline”. Do not worry, we will tell you how to use the Sparkline function to create a progress bar in Google Sheets.
Follow the steps below to create a progress bar in Google Sheets.
- Open your Google Sheets application.
- Enter the data on which you want to create the progress bar.
- Or you can copy-paste the table below to get started.
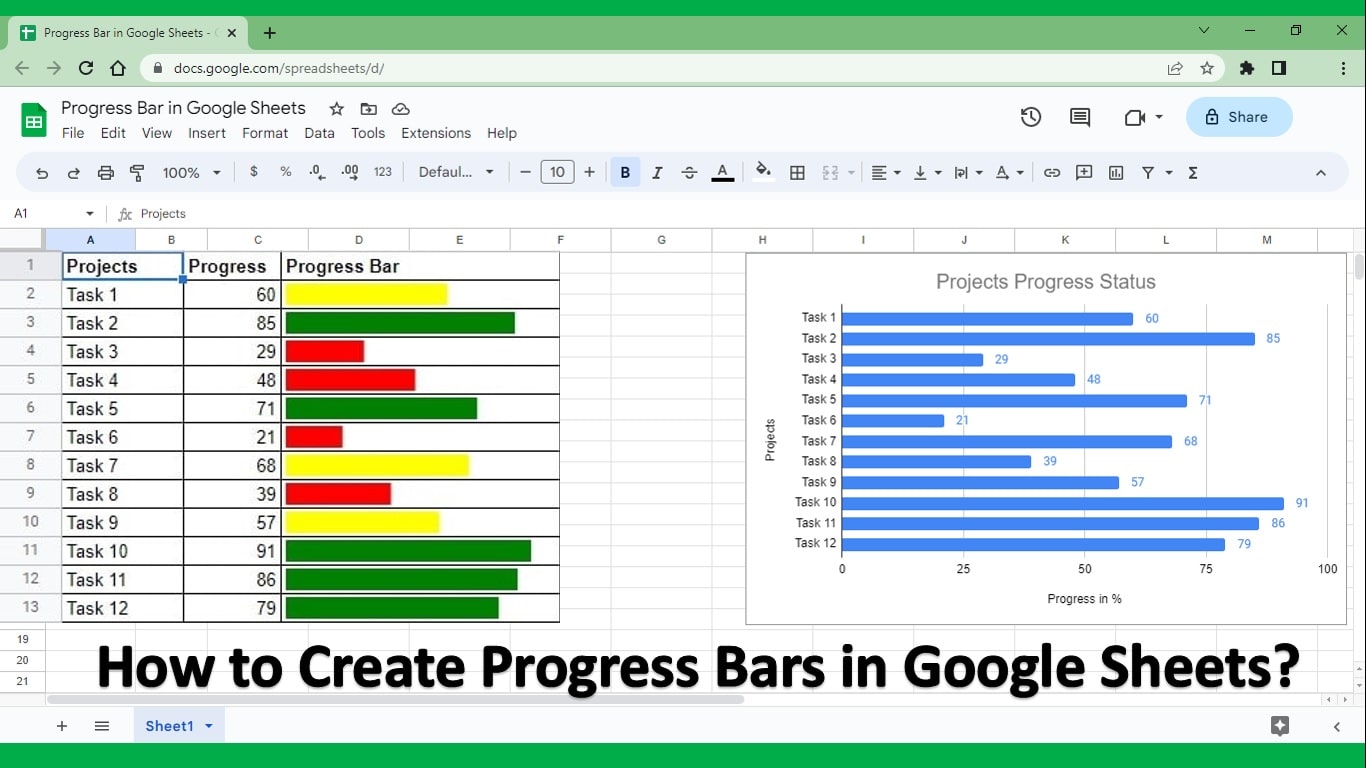
| Projects | Progress | Progress Bar |
| Task 1 | 60 | |
| Task 2 | 85 | |
| Task 3 | 29 | |
| Task 4 | 48 | |
| Task 5 | 92 | |
| Task 6 | 21 | |
| Task 7 | 68 | |
| Task 8 | 39 | |
| Task 9 | 57 | |
| Task 10 | 91 | |
| Task 11 | 86 | |
| Task 12 | 79 |
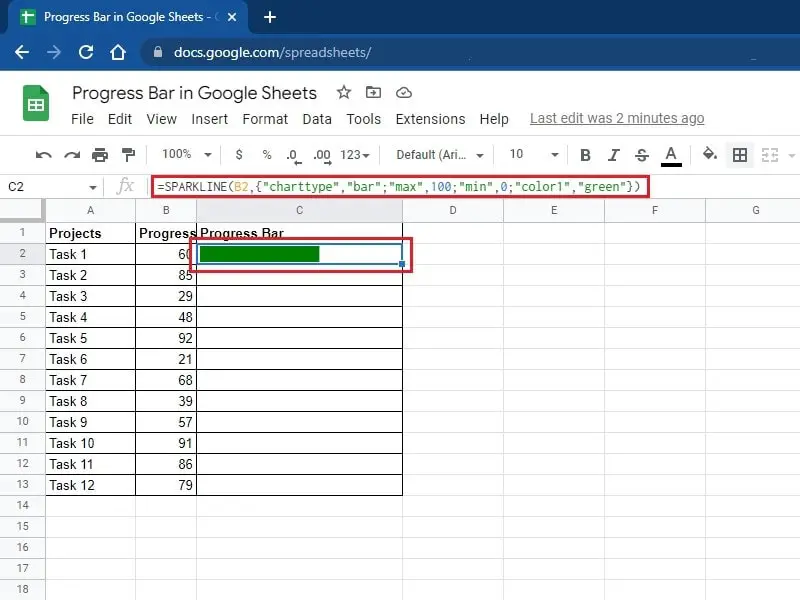
- After entering the data go to cell c2 and enter the following text in it.
=SPARKLINE(B2,{“charttype”,”bar”;”max”,100;”min”,0;”color1″,”green”})
- Once you have entered the Sparkline function in cell C2, you will be able to see a progress bar against Task 1, as shown below.
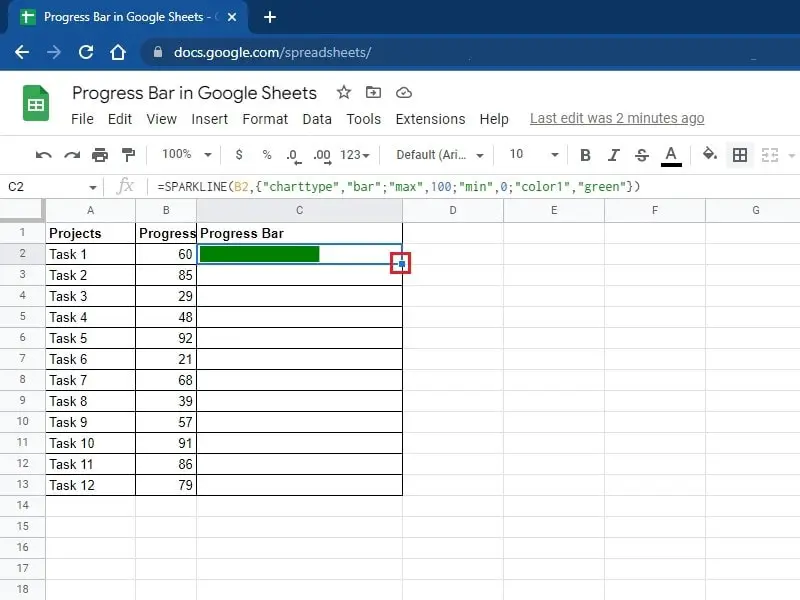
- Now take your cursor at the end of the rectangle of C2 and drag-drop to get the function till the end of the table.
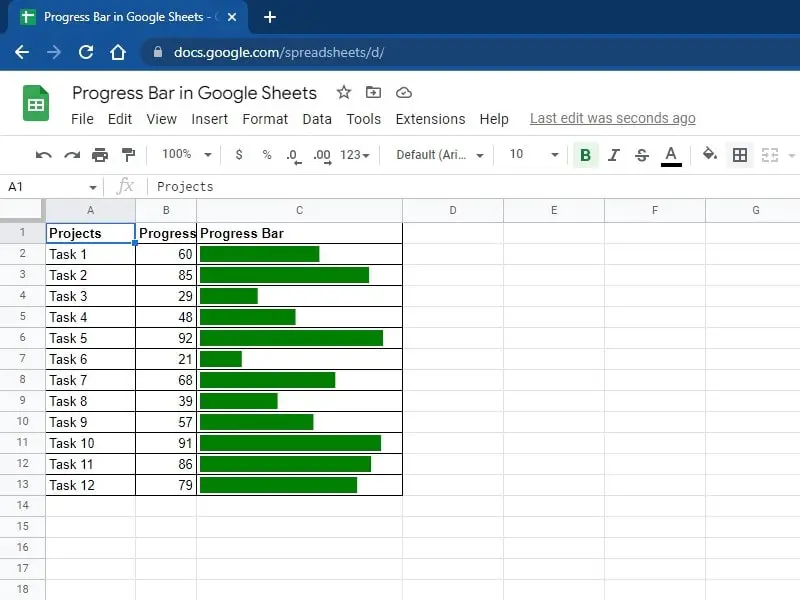
- Congrats, you got the progress bar against all of your tasks as shown below.
- Now the next thing you can do is to assign colors based on values/completion percentage.
- Now copy the following formula in cell C2 and then drag it to get the colors on all tasks.
=SPARKLINE(B2,{“charttype”,”bar”;”max”,100;”min”,0;”color1″,IF(B2>70,”green”,IF(B2>50,”yellow”,”red”))})
- Your final progress bar against each task will look as follows:

-
Creating Progress Bar using Bar Chart in Google Sheets:
There is an alternative way to create progress bars in Google Sheets and that is by using a bar chart to present the status of different tasks in one chart. We will use the same data as we use above to create progress bars using a bar chart.
Follow the steps below to create a progress bar in Google Sheets:
- Open your Google Sheets application.
- Enter the data on which you want to create progress bars.
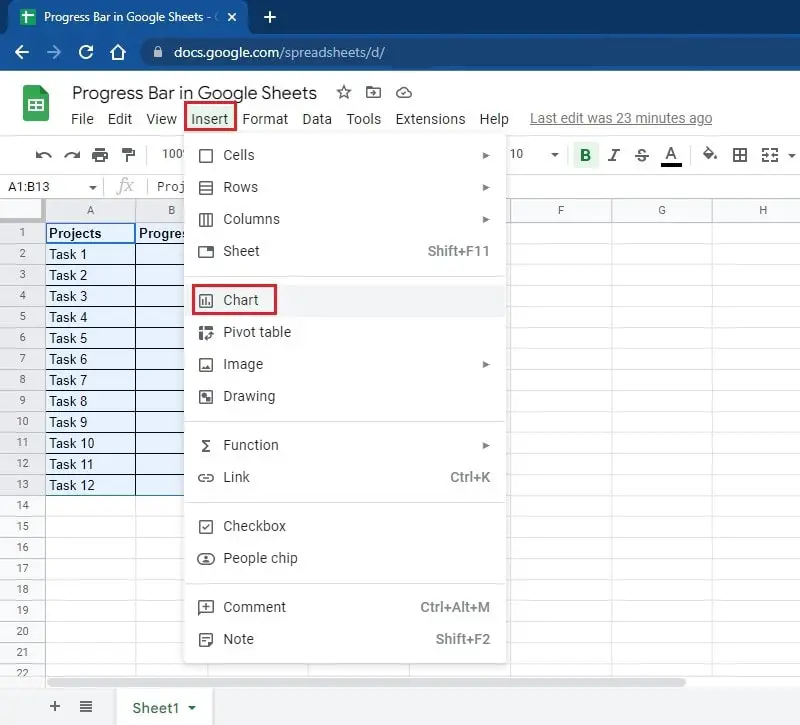
- Now go to the insert tab and then click on Chart, as shown below.
- Based on your data Google Sheets will create a most recommended chart for you. Select the Bar chart from the drop-down list, as shown below.

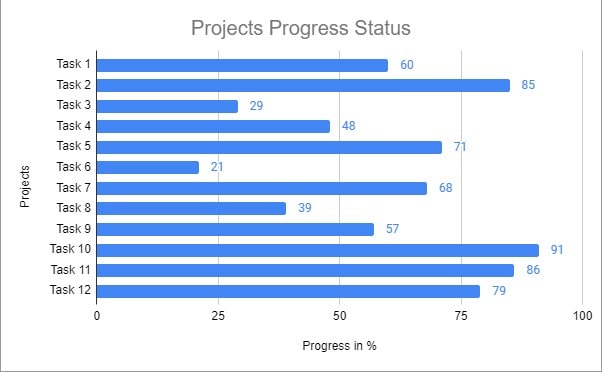
- Your progress bars using a bar chart will look as follows:

- Now Click on “Customize” on the right side in the Chart editor to add a Title and to do the other formatting of the chart.
- Your final progress bar using a bar chart after customization will look as follows, which you can use for your business presentations as well.
With over two decades of experience in writing about Microsoft Excel, Google Sheets, and various other spreadsheet tools, Muhammad Nadeem Salam is your go-to expert for all things data. Since 2004, he has been passionately sharing his knowledge and insights through engaging and informative blog posts, helping countless readers unlock the full potential of their spreadsheet tools.